Region-Specific Quarterly Port Congestion Report: 2024 Outlook
Q4 2023 ended on a challenging note due to various factors like Panama Canal droughts, holiday shipping, and the ongoing Red Sea Crisis. Shipments from Europe to Asia now take a longer route around Cape of Good Hope instead of the Suez Canal but the reroute costs an additional 14-20 days of delay along with skyrocketing freight rates.
The Panama Canal, which plays a vital role in trade between China, the US, and Asia, is currently facing drought conditions. This is causing significant delays for vessels using this route. The number of vessels passing through the canal has decreased from the usual average of 36 per day to 25 per day as of November. It is projected to further decrease to 18 slots per day by February 2024.
The drought situation in the Panama Canal is expected to continue until the start of the rainy season in May. Combined with the ongoing shipping disruption in the Red Sea, the impact of these challenges will extend well into 2024.
Using container dwell time as a measure of congestion, the following ports are the most congested region wise in Q4 2023:
United States
Exports
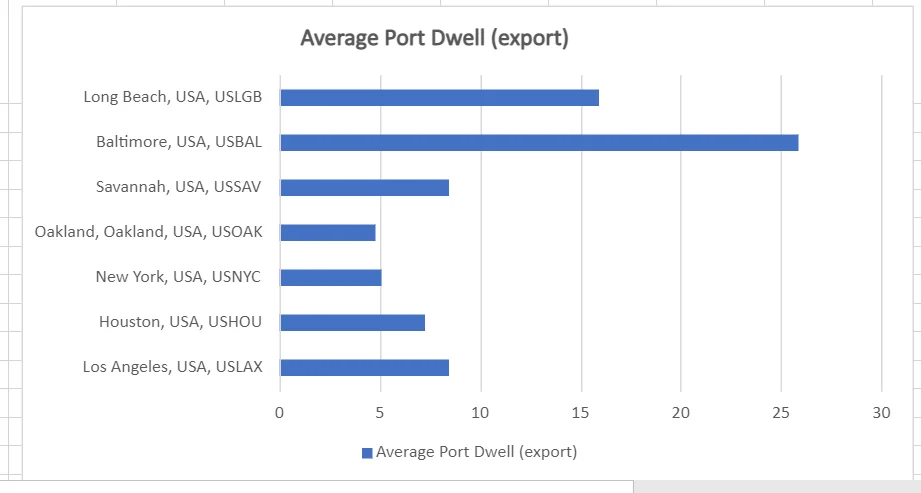
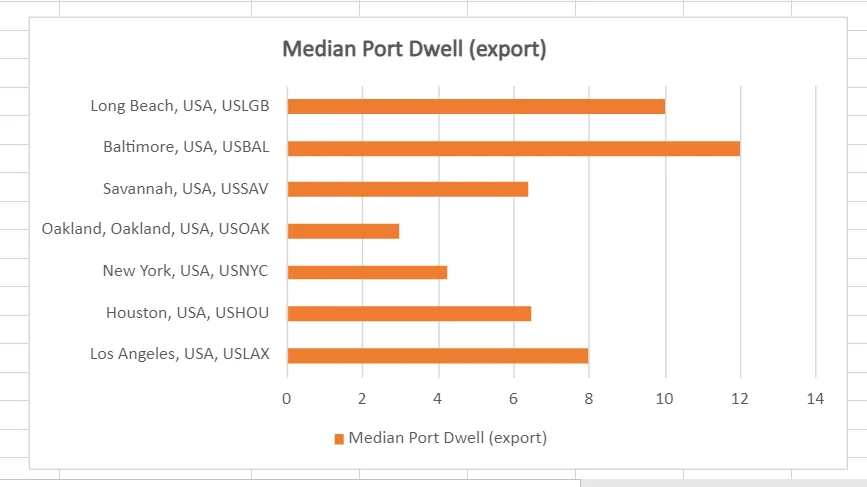
During Q4 2023, the port of Baltimore took the lead in export dwell time, with an average delay of 26 days and a median delay of 12 days. Meanwhile, the port of Long Beach experienced an average dwell time of 16 days and a median time of 10 days, indicating a slightly shorter delay compared to Baltimore.


Imports
Import dwell times in the last quarter of 2023 were notably higher at the port of Los Angeles, with an average of 5.3 days longer than other ports. The median dwell time at this port was 5 days. Comparatively, the port of Oakland had an average dwell time of 4.8 days and a median time of 5.8 days.
Access the complete import insights of US Ports
Europe
Exports
During Q4 2023, the port of Trieste, Italy, stood out in terms of export dwell, with an average of 14.1 days and a median of 14 days. Other ports such as Le Havre, Bremerhaven, and Breivik also reported similar dwell durations.
Access the complete export insights of Europe Ports
Imports
In the Q4 2023, the port of Barcelona, led in export dwell by an average of 10 days and at a median time of 10.6 days. Import activities faced a lot of challenges due to the geo-political situation in the region.
Access the complete import insights of Europe Ports
SEA
Exports
Comparing cargo processing efficiency, Nhava Sheva port emerged as a top performer, with an average dwell time of 4.8 days and a median of 4 days. In contrast, Colombo port lagged behind with an average dwell time of 6.2 days and a median of 5.1 days. Following closely were Port Klang and Pat Bangkok port, while the port of Dhaka stood out for its significant efficiency in Q4 2023.
Access the complete export insights of SEA Ports
Imports
In imports, the port of Singapore had significantly lower dwell times than any other port in the SEA region. The port of Cebu led with highest dwell time with an average of 9.9 days and at a median of 8.8 days due to the regional festive season.
Access the complete import insights of SEA Ports
Conclusion
In conclusion, analyzing port dwell times, imports, and exports is crucial for understanding the performance and dynamics of the ports. Dwell times, representing the duration cargo spends at ports, can impact supply chain efficiency and overall costs. Factors such as infrastructure, customs procedures, port congestion, and labor availability influence dwell times.
Ocean carriers are likely to encounter persisting inefficiencies in the container system during the first half of 2024, as congestion spreads to smaller ports. Nevertheless, the latter part of the year holds potential for marked improvements.
Understand the projections for your next shipment from an expert


