The Platform
The AI-Native Adaptive Platform for Global Trade.We map your exact process and run it end to end. Live in weeks.How it works
Nova: the engine that maps your exact process and runs it.One architecture connecting your products, your AI agents, your data, and your off-platform partners into a single adaptive workflow.AI Agents
Incident Lens24/7 monitoring of shipments, ports, and global events, with alerts mapped to your SLA exposure.VieraConversational analytics that answers in plain language with context, impact, and the next step.GoVistaInbox-native agent that reads, classifies, and actions every shipment email the moment it arrives.Products
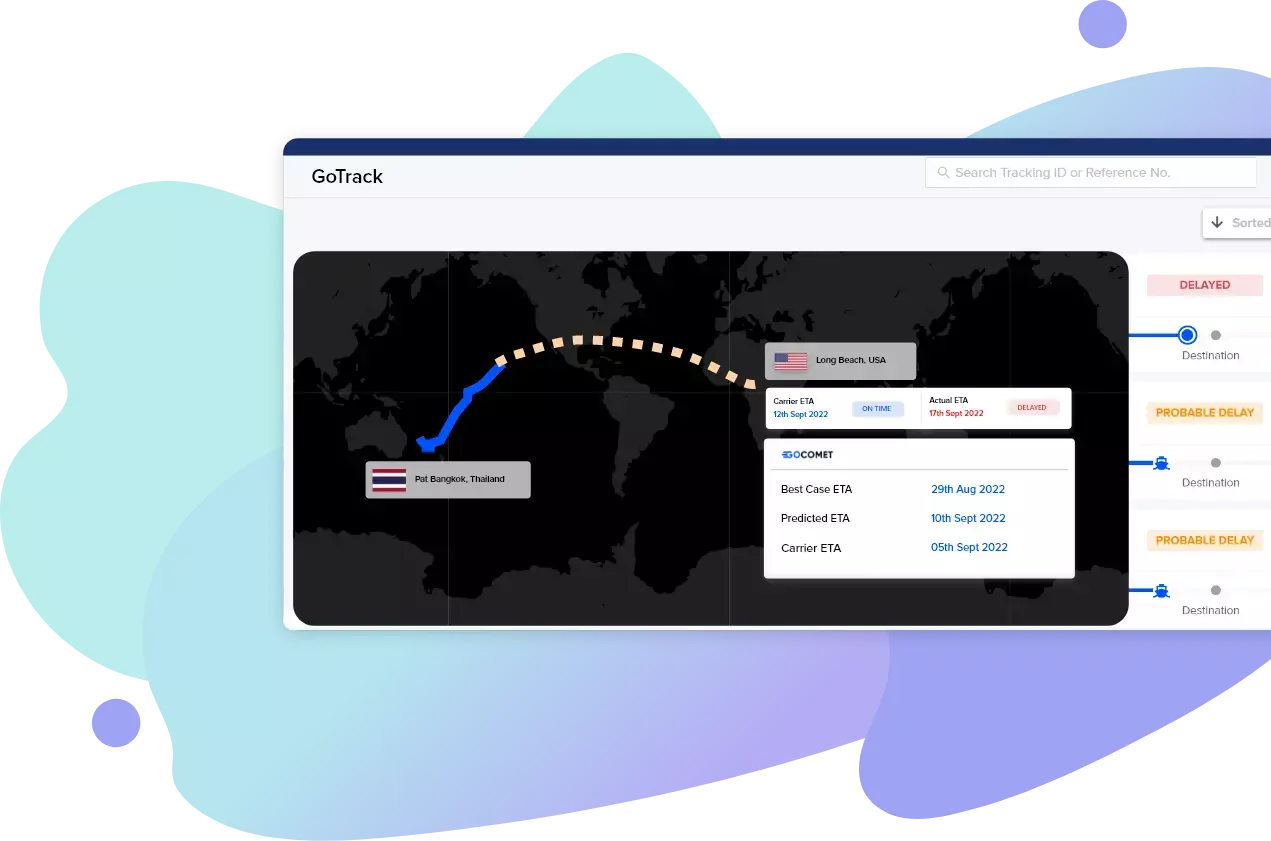
GoOrderPO ingestion and order management with full context.GoProcureCarrier selection and live rate intelligence.GoTrackMulti-modal, multi-leg shipment tracking.GoShipmentEnd-to-end shipment execution and documents.GoInvoiceInvoice reconciliation and three-way match.